Multi-Variable History Charts | AcuRite
Multi-Variable History Chart
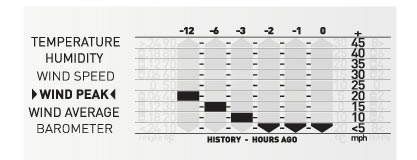 Many AcuRite weather station products include Multi-variable History Charts. This type of chart features a selectable history mode that tracks and displays the changes in conditions for more than one type of data over an allotted time period.
Examples of the type of information that multi-variable charts track include barometric pressure, temperature, humidity and wind speed. You can easily toggle between the multiple charts and readings. The charts allow you to monitor the rate of change over time up to the current time (typically the last 12 hours: -12, -6, -3, -2, -1, 0). An example of a multi-variable chart is pictured on the right.
Products you might be interested in
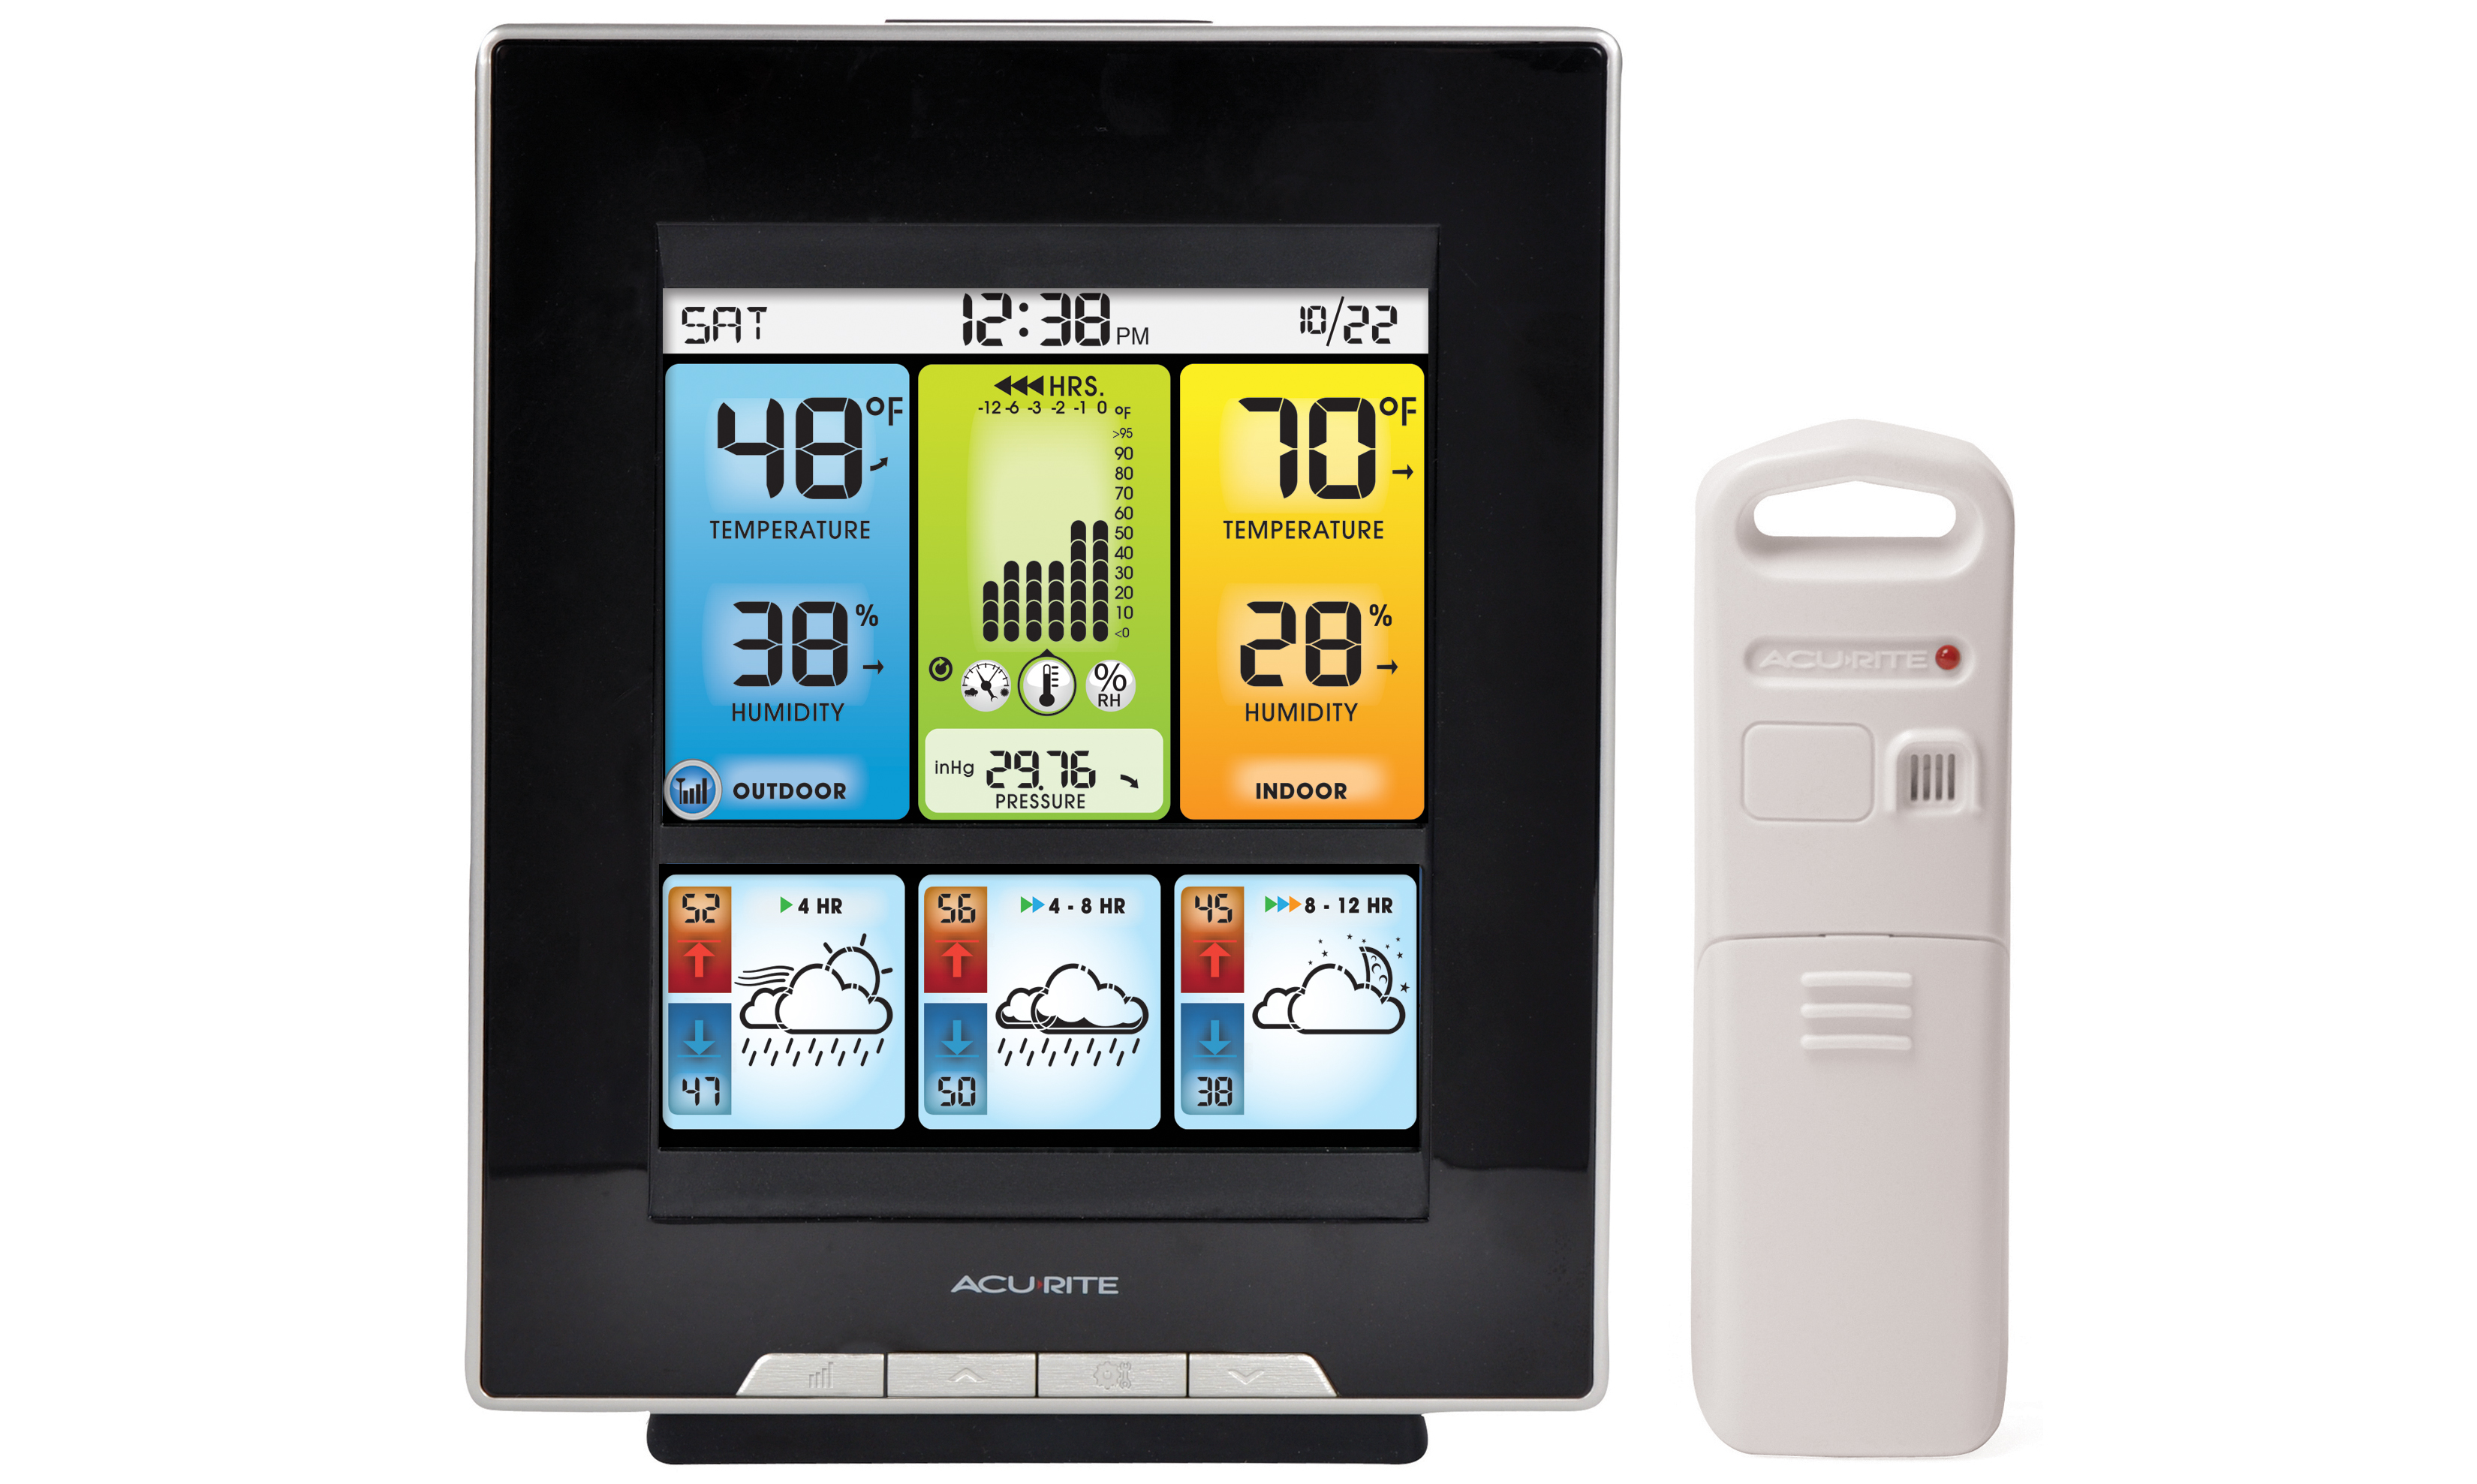
Color Weather Station with Morning, Noon & Night Forecast
- Illuminated color display
- 4-hour, 4 to 8-hour and 8 to 12-hour Precision Forecast of high and low temperatures, cloud cover and precipitation
- 12-hour weather history chart: Toggle between temperature, humidity, and barometric pressure data
- Measures outdoor temperature and humidity
Learn More
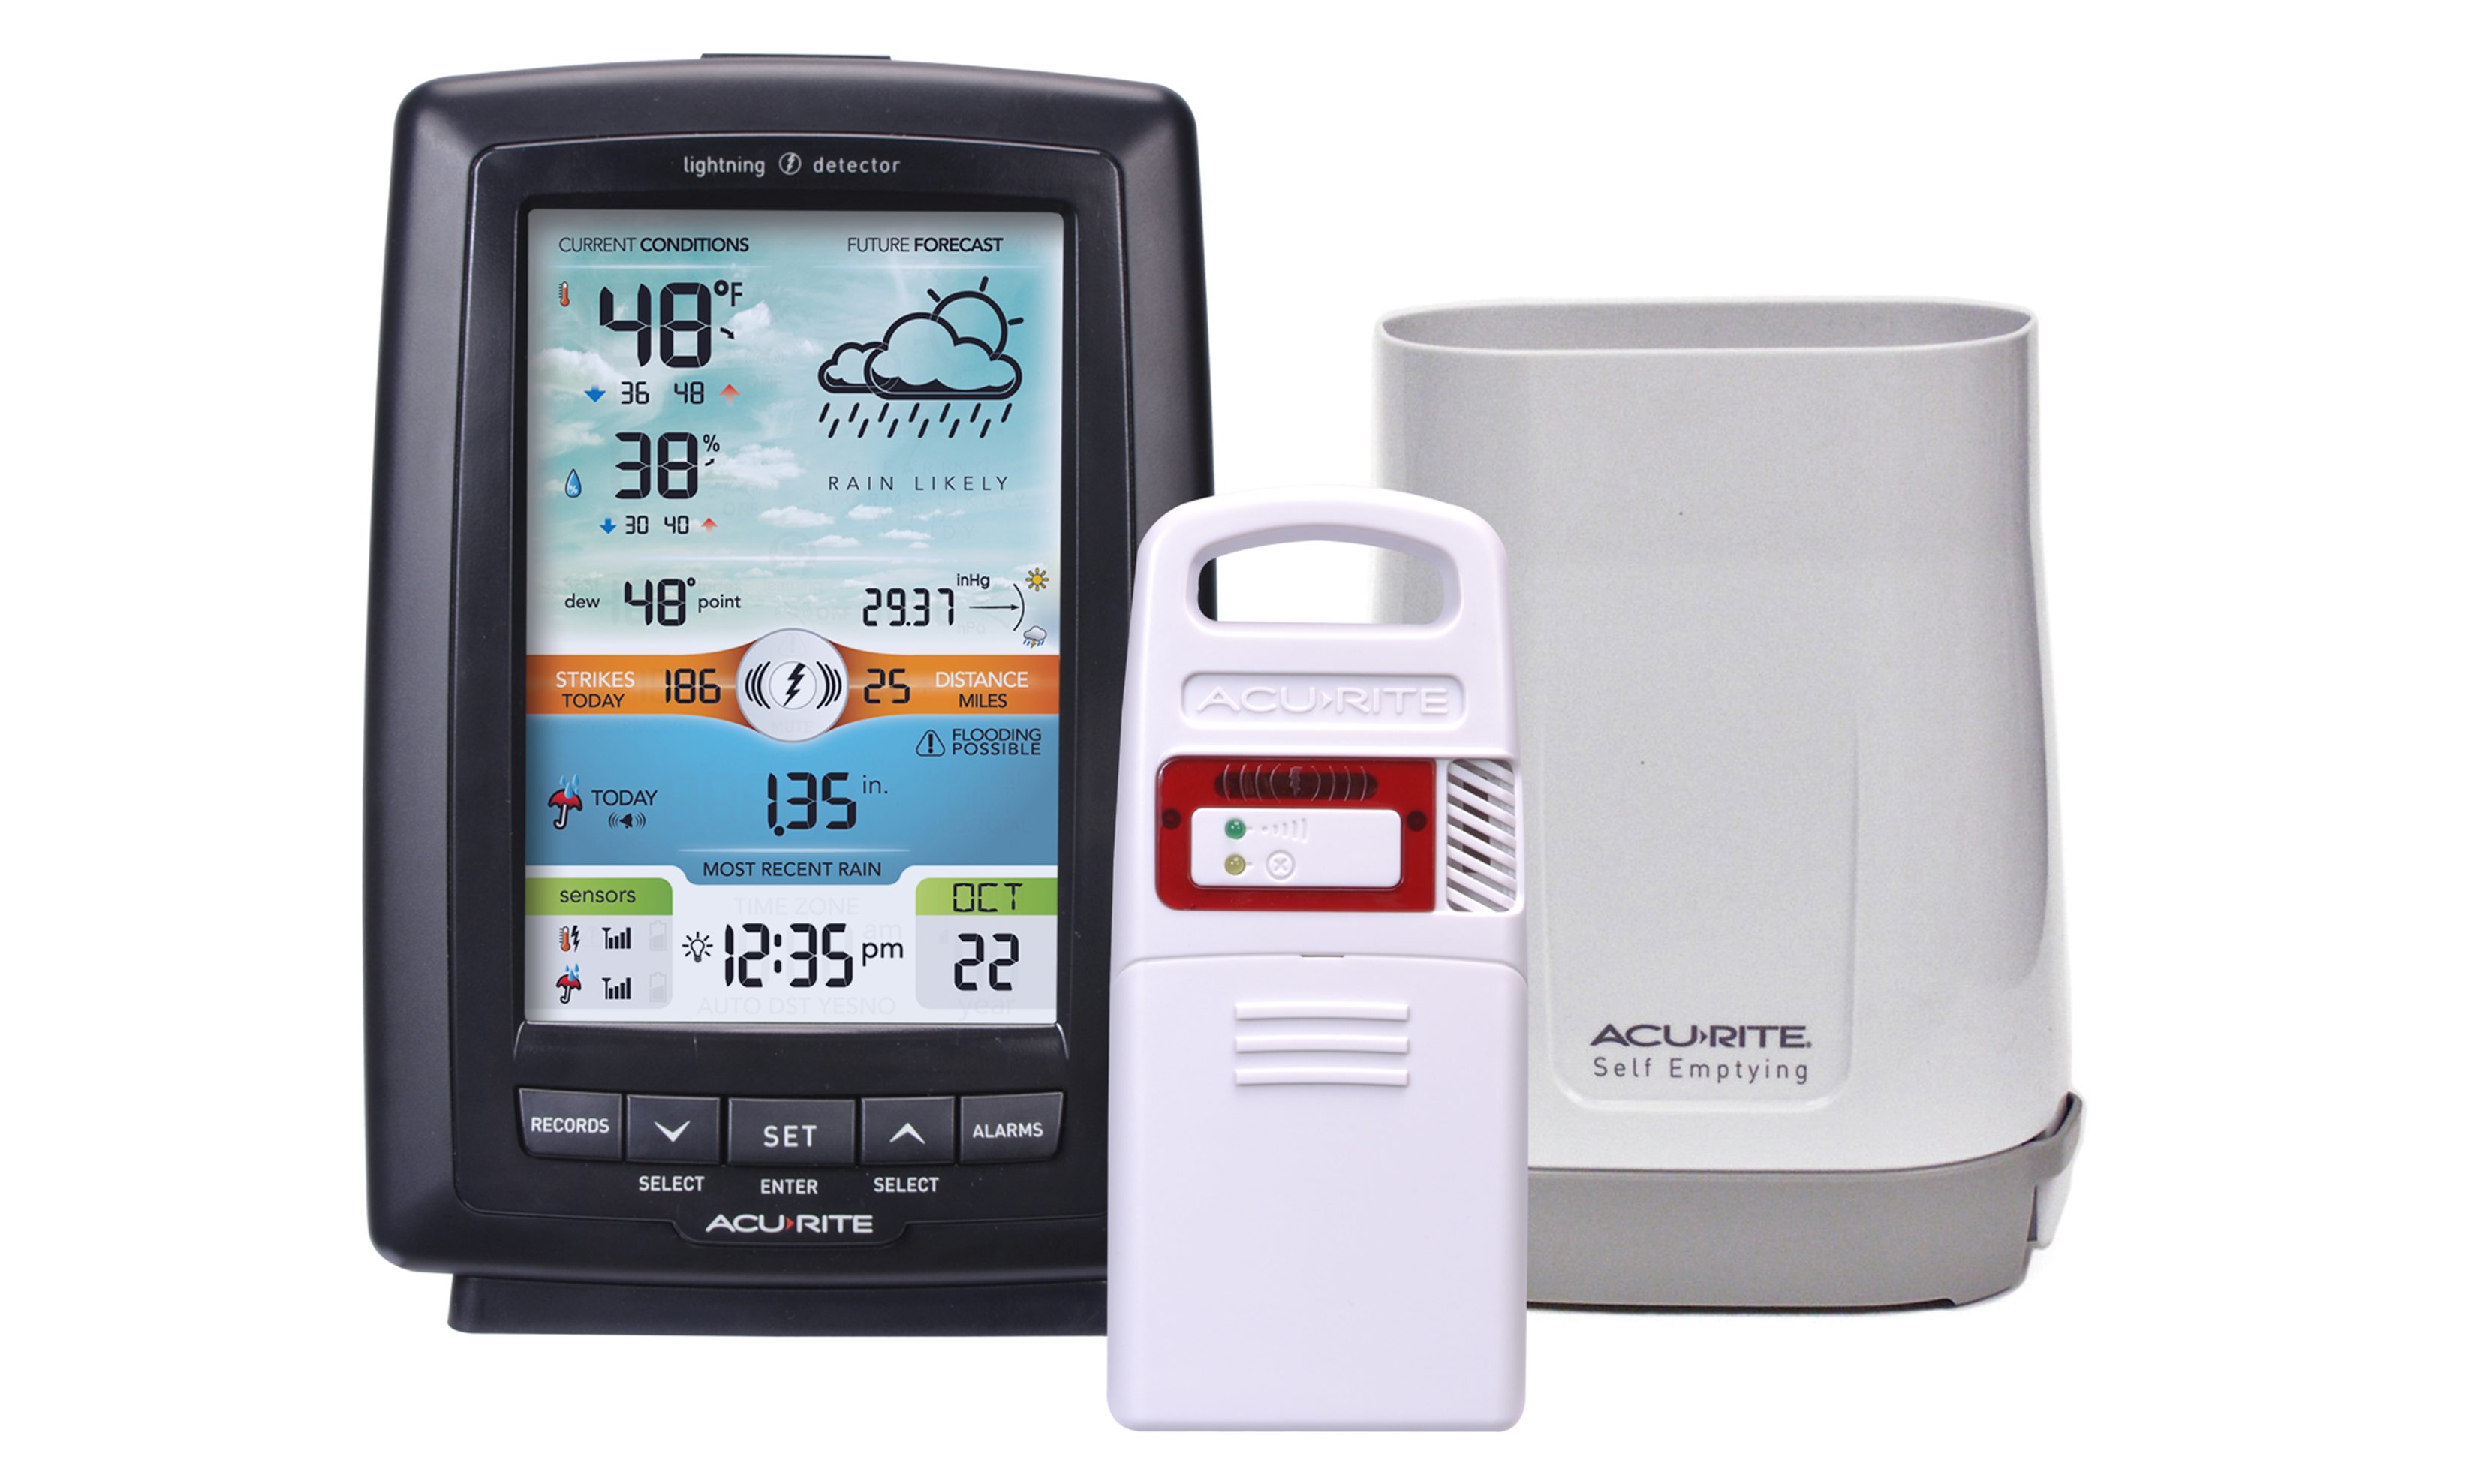
Weather Station with Rain Gauge and Lightning Detector
- Lightning strike counter displays running total of lightning strikes detected, plus weekly and monthly totals
- Provides alerts to lightning strikes with a warning light and audible alarm
- Measures rainfall
- Programmable weather alarms: temperature, humidity, barometric pressure, and rainfall
Learn More