We’re experimenting with new monthly reports in My AcuRite. Kari discusses hers below.
I’m excited to share with you my September Weather Report from My AcuRite and show an example of how the data can be useful in different ways every month.
First, we got RAIN!!! Out here in the Bay Area of California, this is the first rain since May! That’s a big deal. We’re in the heart of fire season right now, so the data I’m interested in is high temperatures and strong winds. This rain is VERY exciting to see this time of year because even a little bit moistens the vegetation (or what we call fuels) just a bit. Any rain helps when fires are a threat.

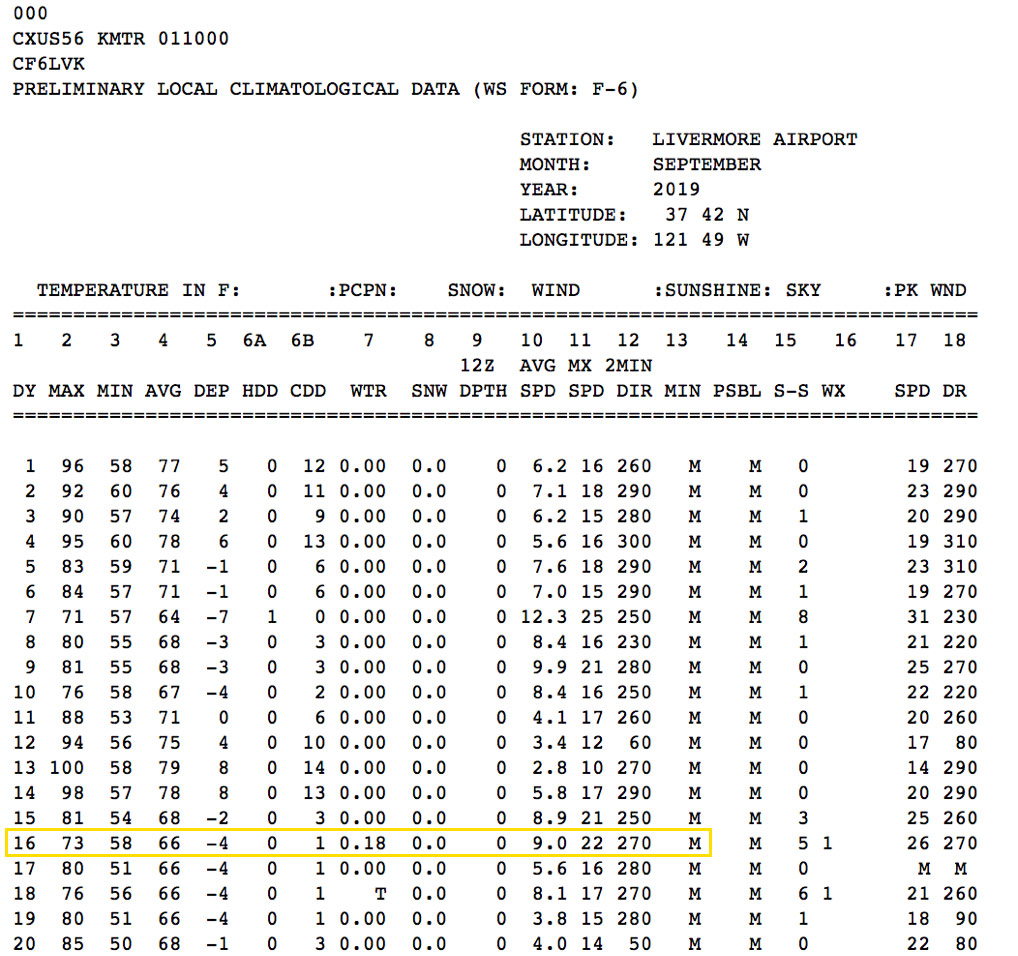
My Atlas reported 0.11 inches on Sept 16th, while the nearby official NWS station at Livermore Airport reported 0.18 inches on that day. It is nice to see these stations in close agreement since my location is within 10 miles of the Livermore airport.

Now let’s look at temperatures. The highest temperature reported by my Atlas in September was 101.4 degrees on the 13th, Livermore reported 100F on that day. The 30-year normal for Sept 13th at Livermore is 85F, so the short heatwave event reached 15 degrees above normal that day. Pretty interesting.

So play around with your AcuRite Monthly Weather Reports and see how your data compares to official NWS weather stations and climatological normals. What weather data do you keep your eye on every month? What data are you tracking and why? What’s the most interesting weather data in your report this month?! Share and discuss below. Until next time!

